Language

اندازه گیری فلورسانس(Fluorescence)
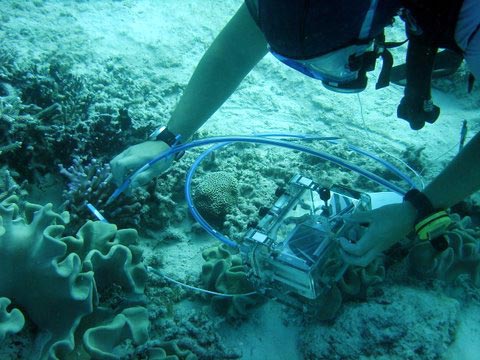
first observed in 1560, fluorescence has evolved into a powerful technique that enables entire fields of cutting-edge science and medicine. The only spectroscopic technique capable of resolving single molecules, fluorescence has moved from the lab to applications limited only by imagination.
The field of fluorescence is as diverse as it is beautiful. The sample under study may be liquid or solid, irregularly shaped, or accessible only outside the lab. A well-configured modular spectroscopy system can easily be reconfigured to study a wide range of samples in both the lab and the field.
Although fluorescence is sophisticated, it doesn’t need to be that complex. The beauty of modular spectroscopy is that you can invent as you go, trying different configurations until you find something that works. The tips and tricks below can help you get startedis
Fluorescence Spectroscopy
miniature spectrometer for Fluorescence Measurements
Fluorescence is the absorption and emission of light of two different frequencies, or wavelengths. This is typically seen in experimental setups when a lower wavelength of incident light is absorbed from one direction, and a higher wavelength of light is emitted in all directions. This is most striking when a sample absorbs UV light and emits visible light.
A sample molecule may be excited electronically and vibrationally by an incoming photon, relax to a lower vibration state by heating the sample around it, and return to the electronic ground state by emitting a lower energy (higher wavelength) photon than the absorbed one.
Fluorescence is used to investigate a number of samples, as fluorescent molecules will absorb a certain wavelength and emit another. With a known incident light wavelength, a sample may be identified by its fluorescent emission spectrum. As fluorescence occurs on a molecular scale, it is the only spectroscopic technique capable of identifying single molecules.
Making Fluorescence Measurements
A fluorophore’s excitation spectrum shows how efficiently fluorescence will be generated as a function of excitation wavelength. The excitation and emission spectra for a fluorophore often overlap, with emission at longer wavelengths (Figure 1).

Figure 1: Emission and excitation spectra for a fluorophore often overlap
Modular spectrometers, excitation sources and accessories allow users to optimize systems for a variety of parameters, and to easily switch between fluorescence and absorbance measurements. In addition, spectrometers such as the QE Pro and Flame have interchangeable slits to accommodate different measurement needs.
Spectrometers
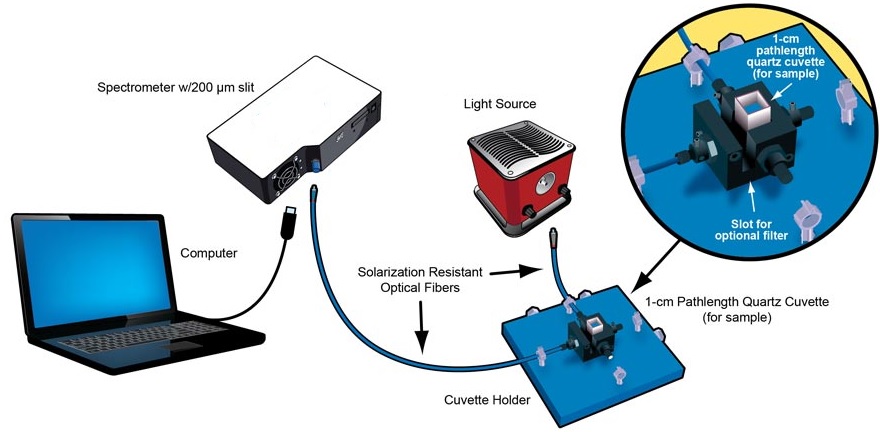
Figure 2: Spectrometers that use a high sensitivity, back-thinned CCD detector are excellent options for fluorescence measurements